
EXAMPLE INSIGHTS
Every snapshot is tailored to your website.
Here's an example of the insights we provide.

01
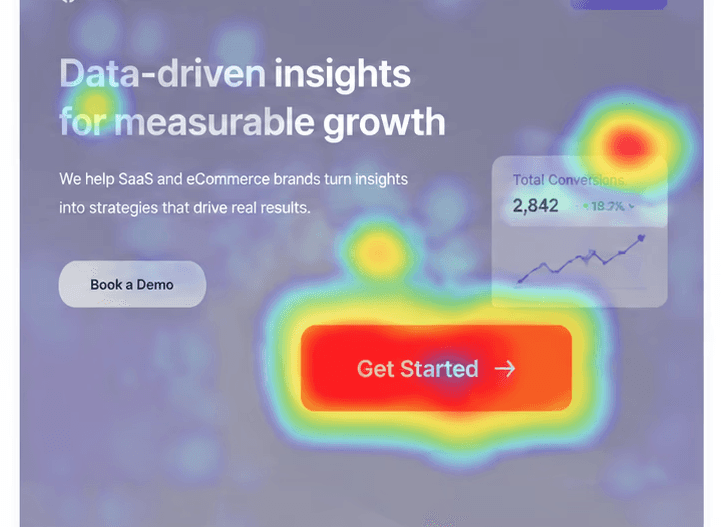
Users repeatedly click on images and icons expecting them to be interactive.
Recommendation: Make elements clickable or improve visual affordance.
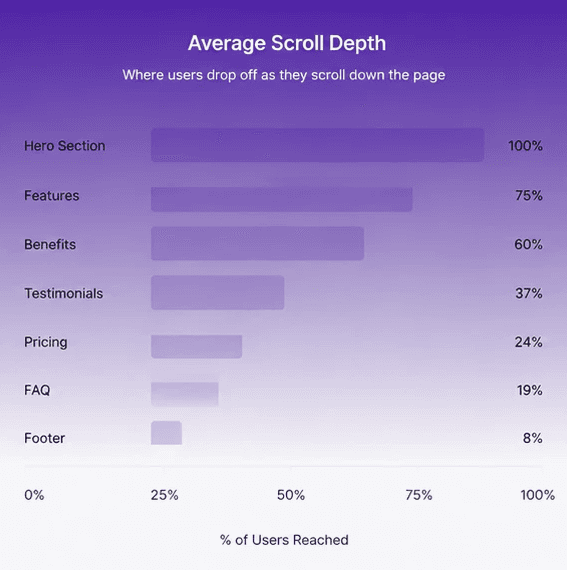
02
Only 35% of visitors scroll far enough to see key benefits.
Recommendation: Move important information higher on the page.
03
WHO IT'S FOR
Perfect for businesses that..
✔ Want to understand real user behavior
✔ Have traffic but limited conversions
✔ Suspect usability or navigation issues
✔ Want evidence-based improvements
✔ Need prioritized recommendations that drive impact
FAQ
Frequently asked questions
What data is used for the analysis?
The analysis is based on heatmaps, session recordings, click patterns, scroll depth, and other user behavior data available through your analytics and behavior tracking tools.
Will I have access to the heatmaps?
Yes. If you already have a heatmap tool installed, the analysis will be based on your existing data. We review the findings and provide clear recommendations based on user behavior patterns.
How is this different from a Conversion Snapshot?
Conversion Snapshot focuses on the overall user journey across key pages and identifies broader conversion opportunities. Heatmap & Behavior Analysis goes deeper into how users interact with individual pages using behavioral data such as clicks, scrolling, and attention patterns.
What if I have lower traffic?
That’s completely fine. We can still review available behavior data and identify usability issues and improvement opportunities. However, websites with higher traffic generally provide more reliable behavioral patterns and stronger insights.
Get Started Now →
Questions? Contact us